Housing Market Recovery Index Highlights – Week Ending January 23
- The realtor.com Housing Market Recovery Index reached 103.7 nationwide last week, up 0.3 points over the prior week.
- The ‘housing demand’ component increased 2.1 points to 116.9, growing but at a slower pace than in December.
- The overall recovery index is showing greatest recovery in Portland, Los Angeles, Denver, Boston, and Las Vegas.
Download the full Housing Market Recovery Index dataset here.
National Recovery Trends
Despite a slower than anticipated return of buyers and sellers this January, the U.S. housing market continues to remain tight and in position for further growth this spring. The realtor.com Housing Market Recovery Index reached 103.7 nationwide, up 0.3 points over the prior week. The overall index still remains above the pre-COVID baseline, with all measures growing faster than this time last year, with the exception of new listings.
The pace of sales and price gains remained stable but well above pre-pandemic pace and with no clear signs of deceleration. At the same time new listing activity remained restrained despite a slight improvement this week, with the ‘new supply’ component increasing 0.8 points to 87.3, hinting that many sellers are still hesitant and cautious in the new year. On the flip side, growth in home shopping activity remains elevated and saw the biggest improvement, with the ‘housing demand’ component climbing 2.1 points to 116.9.
| Week ending 1/23 | Current
Index |
w/w Change | |
| Overall Housing Recovery Index | 103.7 | +0.3 | |
| Housing Demand Growth Index | 116.9 | +2.1 | |
| Listing Price Growth Index | 110.8 | -0.6 | |
| New Supply Growth Index | 87.3 | +0.8 | |
| Pace of Sales Index | 108.6 | +0.0 |
The ‘housing demand’ component remained above recovery and increased to 116.9 this past week, up 2.1 points over last week but still down compared to the 122.9 point average over the course of December. In the last four weeks, the pool of active buyers has continued to grow but at a visibly slower rate than observed in the fall. Buyers remain motivated but watchful of interest rates and frustrated by a shrinking number of homes available.
The ‘home price’ component fell slightly to 110.8 points this past week but remains well above the January 2020 baseline and remains higher than the 109.7 point average over the course of December. With inventory failing to see visible improvement, asking prices continue to rise near record levels even as short term economic and COVID concerns fail to disappear.
The ‘pace of sales’ component – which tracks differences in time-on-market – held well above the pre-COVID baseline at 108.6, the same as the previous week but lower than the 114.9 point average over the course of December. Despite the moderate deceleration, homes continue to move at a record pace for this time of the year and faster than in pre-pandemic times.
The ‘housing supply’ component – which tracks growth of new listings – has been slow to recover in the first two weeks of the new year but continues to move slowly in the right direction. Last week, the supply component rose slightly to 87.3, 0.8 points above the previous week but still down compared to the 107.6 point average over the course of December. We’ve seen selling activity remain volatile in the post-pandemic period, and this relatively slow start to the year by sellers confirms disruptions in the broader national landscape are impacting the shape of the recovery.
LOCAL TRENDS
The overall recovery index in the 50 largest metros saw a slow start to 2021. This week saw improvements to the recovery index for the Midwest and South, while the West and Northeast slowed. This movement was driven by a deceleration of newly listed homes and a slowing of time spent on market in some western metros – at least when compared to their blistering pace at the beginning of 2020. Several metros also saw demand slow over the past week.
| Region | Avg Recovery Index
(week ending 1/23) |
w/w Change | |
| West | 107.6 | -4.6 | |
| Midwest | 102.4 | +0.9 | |
| Northeast | 101.5 | -2.4 | |
| South | 103.7 | +1.2 |
36 of 50 Largest Markets Start Above Recovery Benchmark
Locally, a total of 36 markets have remained above the recovery benchmark, up from 35 the previous week. Most markets have struggled to sustain the feverish pace of growth observed before the holidays, with 14 markets dipping below the recovery pace, at least temporarily. The overall recovery index is showing greatest recovery in Portland, Los Angeles, Denver, Boston and Las Vegas36 of 50 Largest Markets Above Recovery Benchmark
In the ‘housing demand’ component, 45 of the 50 largest markets are still positioned above the recovery trend, up by 3 from the previous week, as buyer demand remains strong in the face of many disruptions. The most recovered markets for home-buying interest include Austin, Miami, Houston, San Antonio, and Seattle; with a housing demand growth index between 137 and 153.
In the ‘home price’ component, 33 of the 50 largest markets seeing growth in asking prices surpass the January baseline, the same as the previous week. The most recovered markets for home prices include Austin, Pittsburgh, Riverside, Richmond, and Houston, with a home price growth index between 113 and 128.
In the ‘pace of sales’ component, 43 of the 50 largest markets are now seeing the time on market index surpass the January baseline, the same as the previous week. The most recovered markets for time-on-market include Los Angeles, Portland, Riverside, Louisville, and Phoenix; with a pace of sales growth index between 135 and 151. This past week, San Jose and San Francisco saw their ‘pace of sales’ scores fall well below the recovery point. While the time spent on market in these metros has not significantly risen, it has failed to keep up with the blistering drop in time on market seen in late January and early February 2020, right before the onset of the pandemic.
In the ‘housing supply’ component, only 11 of the 50 largest markets saw the new listings index remain above the January baseline, two fewer than the previous week. Interestingly, markets where new supply is improving the fastest tend to be higher priced than those that have yet to see improvement, suggesting sellers are more active in the more expensive markets. The most recovered markets for new listings included San Jose, Denver, San Francisco, Los Angeles, and Las Vegas, with a new listings growth index between 115 and 137. While San Jose and San Francisco new listings still outpace January 2020, it’s worth noting that the pace of new listings growth is down considerably compared to December in these metros, which has had a large impact on their recovery scores this week.
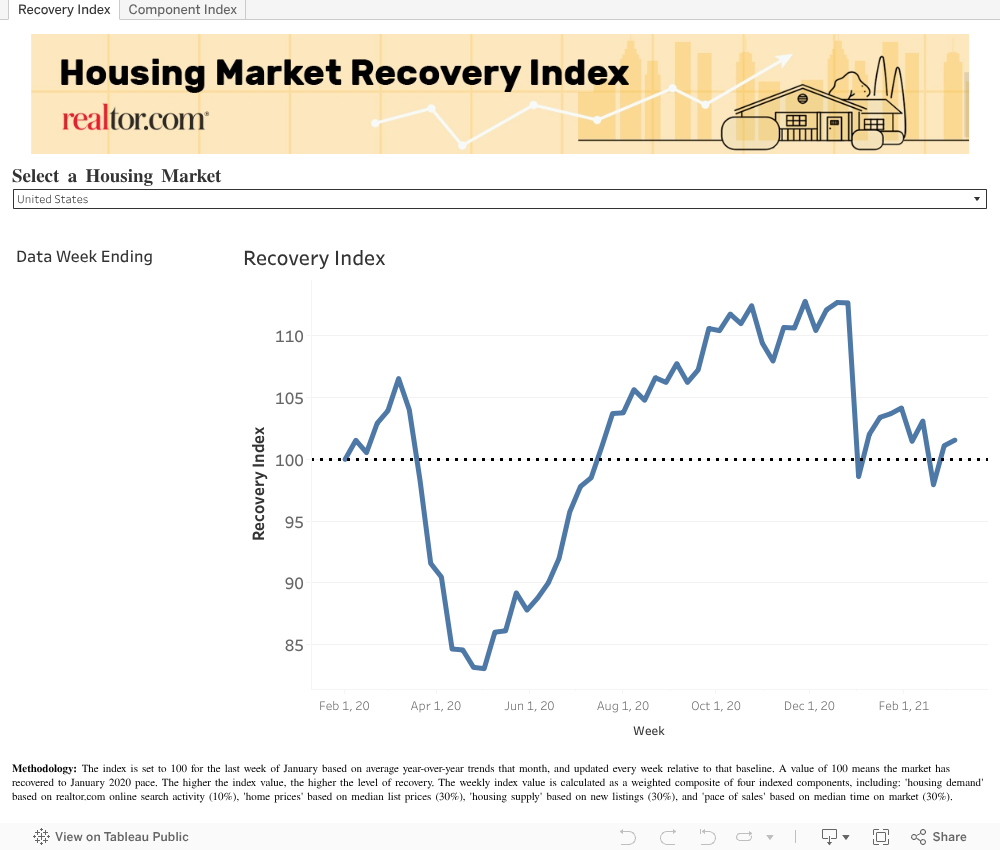
How to read the index – the overall index is set to 100 for the last week of January based on average year-over-year trends that month, and updated every week relative to that baseline. A value of 100 means the market has recovered to January 2020 pace. The higher the index value, the higher the level of recovery. The lower the index value, the lower the level of recovery.
Subscribe to our mailing list to receive monthly updates and notifications on the latest data and research.