
Our research team releases regular monthly housing trends reports. These reports break down inventory metrics like the number of active listings and the pace of the market. In light of the ongoing COVID-19 pandemic, we want to give readers more timely weekly updates. Generally, you can look forward to a Weekly Housing Trends View near the end of each week along with a weekly video update from our economists. Here’s what the housing market looked like over the last week.
In addition to a time of remembrance, for many, the Memorial Day weekend marks the start of the summer complete with barbecues, vacations, and pool or beach time. It’s also when home buying season is in full swing. This year’s holiday fell almost a week later and this shift is likely behind the dip in new sellers this week. With home prices at record highs, seller confidence up, and more homeowners planning to make a move, we expect that we’ll see more new sellers in the weeks ahead, making this dip a temporary one.
Weekly Housing Trends Key Findings
Key Findings:
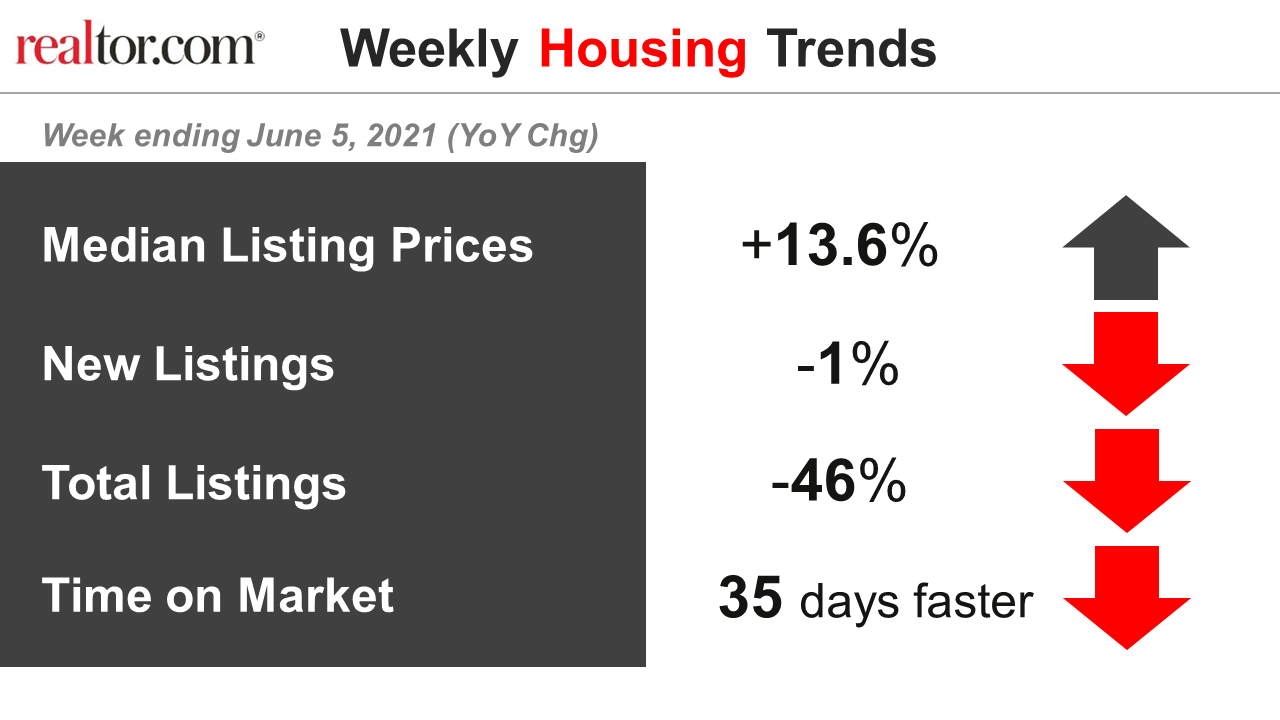
- Median listing prices grew at 13.6 percent over last year, marking 43 consecutive weeks of double-digit price growth. The rate of growth in the typical asking price picked up this week, but the pace remains lower than any of the monthly rates seen so far this year. Even as price growth slows, median home listing prices hit a 4th consecutive record-high in May at $380,000, and prices are on track to set another record or two before cooling later this fall.
- New listings–a measure of sellers putting homes up for sale–were down 1 percent, taking a dip after 8 consecutive weeks of increases over last year. The influx of new sellers over the last couple of months has helped slow price gains. A combination of rising seller sentiment and more homeowners planning to sell should mean this week’s dip is a temporary one. Roughly two-thirds of those responding to a recent survey said it was a good time to sell. With home prices up in many markets, even those who haven’t owned a home for long may find that selling is a viable option if they’re ready to make a change.
- Total active inventory is down again, but just 46 percent from this time last year. This means a still limited number of homes for sale, but a substantial improvement over the last few weeks. The shifting Memorial Day holiday, which fell almost a week later this year than last year, likely played a role. This figure will be an important one to watch in the weeks ahead, as it may signal more balance on the horizon.
- Time on market was 35 days faster than last year. The typical active listing hasn’t been sitting long, hitting a record fast pace of 39 days in May. Fast time on market is expected to continue through mid-summer, as it typically does each year.
Data Summary
Recent Weeks:
| All Changes year-over-year | First 2 Weeks March 2020 |
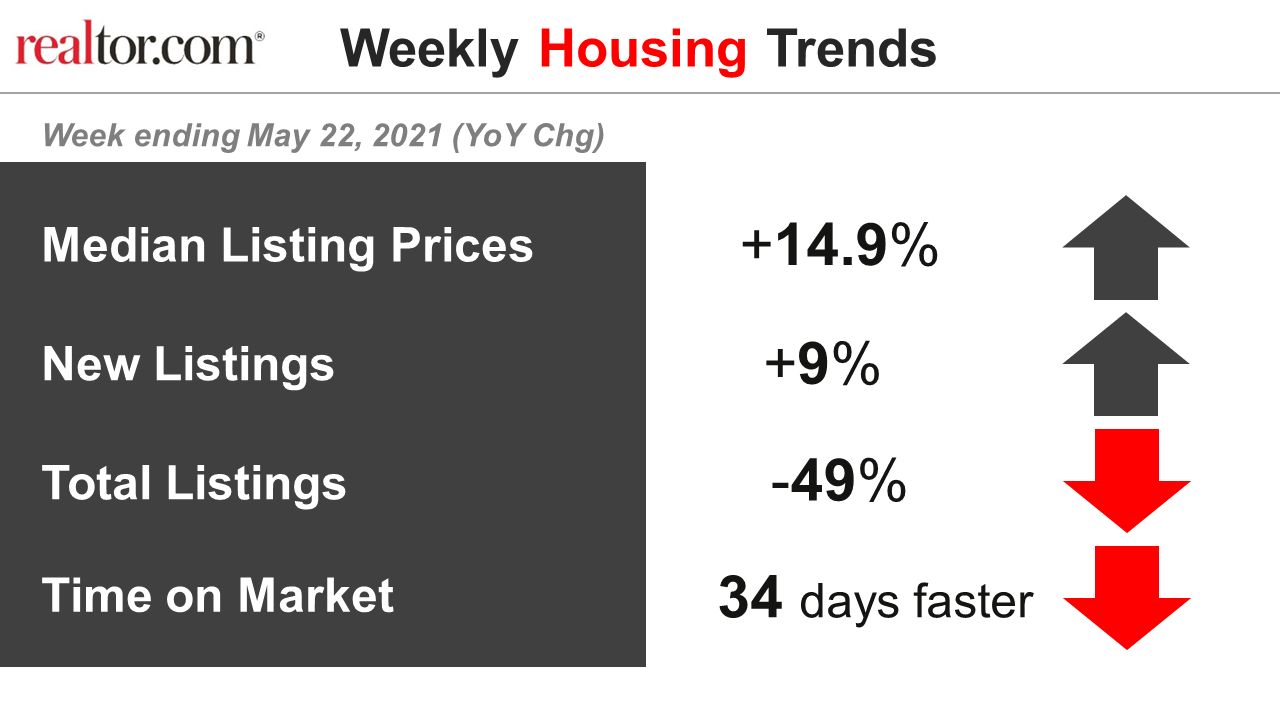
Week ending May 22, 2021 | Week ending May 29, 2021 | Week ending June 5, 2021 |
| Median Listing Prices | +4.5% | +14.9% | +13.1% | +13.6% |
| New Listings | +5% | +9% | +9% | -1% |
| Total Listings | -16% | -49% | -49% | -46% |
| Time on Market | 4 days faster | 34 days faster | 35 days faster | 35 days faster |
 You can download weekly housing market data from our data page.
Subscribe to our mailing list to receive monthly updates and notifications on the latest data and research.