- COVID-19 seems to be affecting the ability of all generational groups to purchase with a mortgage* equally, for now, as loan origination shares follow ongoing trends
- Generation Z has caught up to the Silent Generation in its share of primary home purchase loan originations
- Millennials are now purchasing primary homes (with mortgages) that are the same price as baby boomers, but they are also taking on larger loans due to low down payments
- In response to COVID-19, millennials seem to be more rooted in place compared to Generation X and baby boomers
States and cities across the country have implemented social distancing measures in response to the ongoing COVID-19 pandemic. As a result, fewer home sales are taking place as would-be home shoppers can’t view homes, are taking a wait-and-see approach, or are already taking a hit to their ability to purchase a home due to job or income loss. In this report, we look at what, if any effects, COVID-19 has had on each generation’s ability to purchase a home, through the lens of mortgage origination data, and what, if any, geographical differences there are in where each generation is still actively purchasing a home in the midst of the pandemic.
COVID-19 Crisis Has Not Yet Shifted the Mix of Loan Originations Between Generational Groups
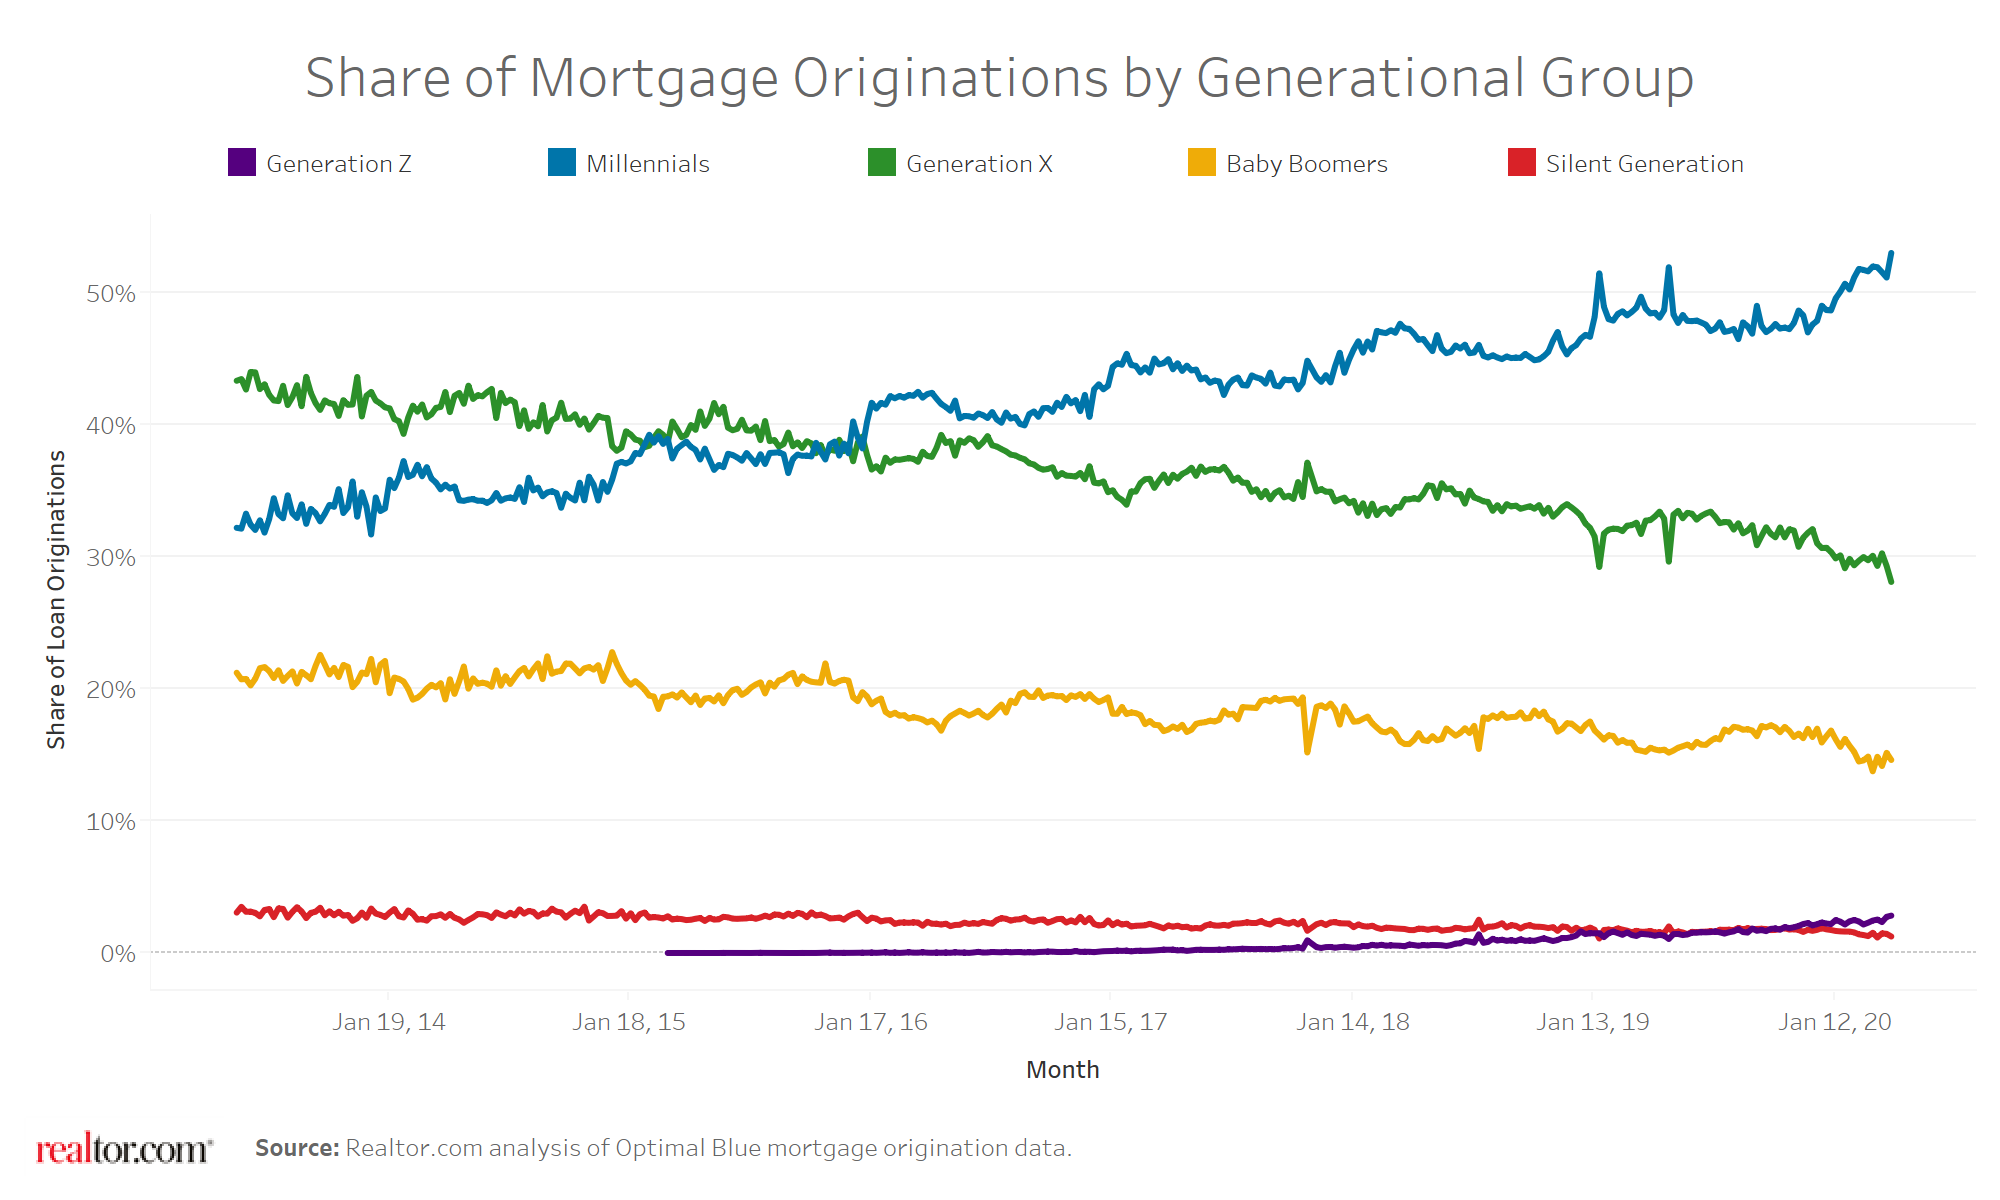
Although overall primary home purchase mortgage originations are down due to the ongoing COVID-19 social distancing measures and resulting unemployment, the generational mix of these mortgage originations stayed true to historical trends, indicating that COVID-19 so far has impacted the ability for all generations to purchase a home with a mortgage equally*. Millennials and Generation Z continue to grow their share of the primary housing market. By the week ending April 11, 2020, the millennial share of primary home purchase loan originations grew to 53 percent from 49 percent during the same time last year. The Generation Z share grew to 3 percent from 1 percent during the same time last year. The Generation X share continued to fall, to 28 percent from 33 percent last year, and the baby boomer share has decreased but less significantly, to 15 percent, from 16 percent last year.
Figure 1: Share of Primary Home Purchase Mortgage Originations by Generational Group
Generation Z Catches up to the Silent Generation in Primary Home Loan Origination Share by Dollar Volume
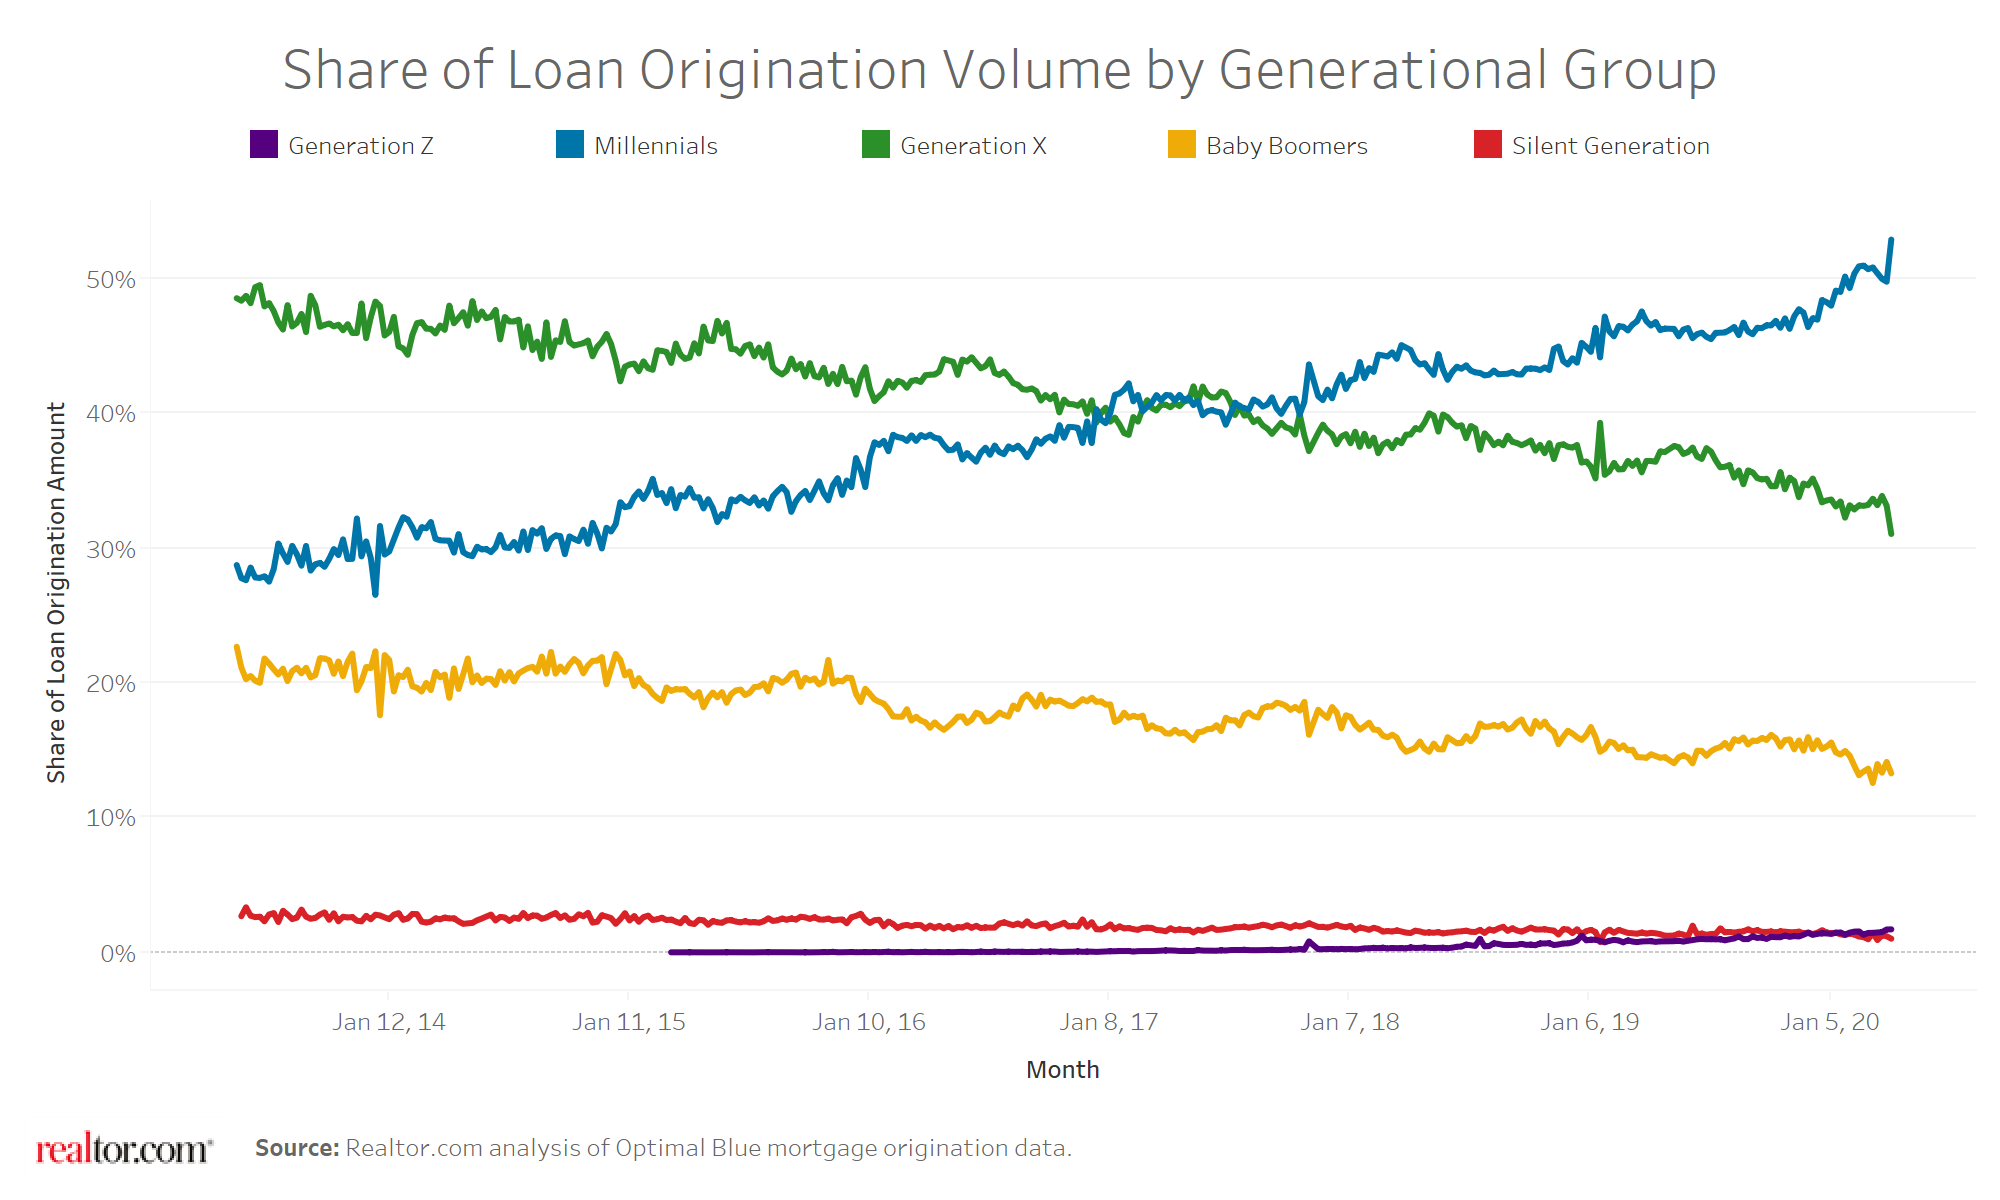
The share of primary home purchase loan originations by total dollar volume for millennials and Generation Z also increased over the past year. The millennial share grew to 53 percent, from 47 percent during the same time last year. Generation Z’s share grew to 2 percent from 1 percent during the same time last year. Last quarter we noted that Generation Z is set to surpass the Silent Generation in the share of primary home purchase loan originations by total dollar volume. This quarter, Generation Z has indeed overtaken the Silent Generation. Meanwhile, the Generation X share fell to 31 percent from 36 percent and the baby boomer share fell to 13 percent from 15 percent.
Figure 2: Share of Primary Home Purchase Mortgage Origination Dollar Volume by Generational Group
Millennials Catch Up to Baby Boomers in Purchase Price of Primary Homes for the First Time
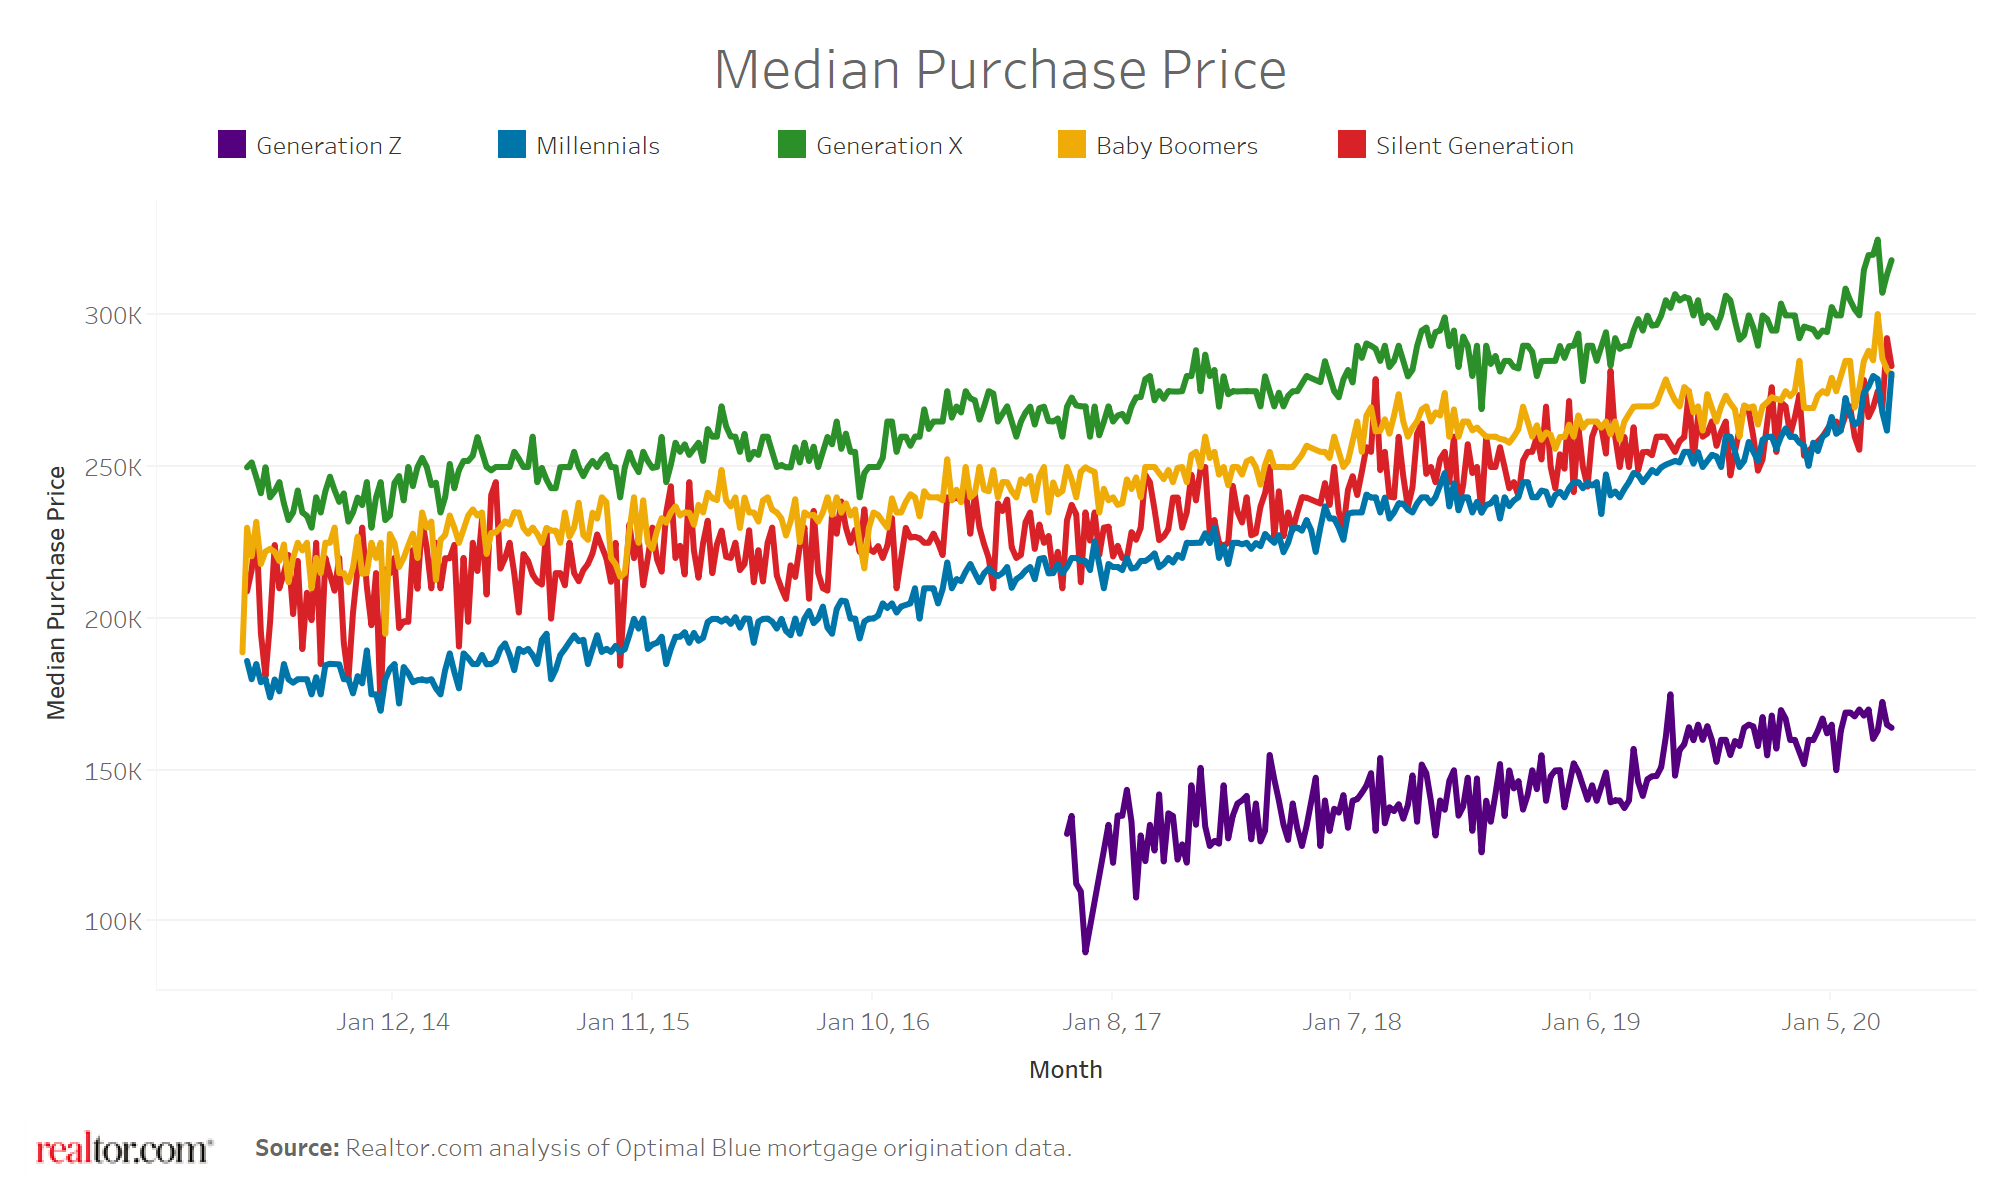
All Generations continued to purchase increasingly expensive homes in the first quarter, with no post-COVID-19 impact on the median purchase price growth trend yet visible when examining the weekly data. The median price of a primary home purchased by millennials rose by 9 percent over the past year to a high of $280,800 in the week ending April 11. Generation Z’s median purchase price grew by 13 percent to $164,000.
Millennials have finally bridged the gap between their median purchase price and the median price of a home purchased by Baby Boomers, which stood at $282,000 in the week ending April 11, a difference of only $1,200.
Figure 3: Median Purchase Price by Generational Group
Lower Down Payments, Higher Debt Burdens Among Younger Generations Persist
Last quarter we saw that despite the gap in purchase prices narrowing between millennials and older generations, the gap in down payments remained persistent. In April, the typical millennial contributed a down payment of 7.8 percent toward the purchase of their home, down from 8.8 percent last April, and less than the 11.6 percent and 17.8 percent contributed by the typical Gen X-er and boomer, respectively. Worryingly, after a slight rise in the average down payment percent from millennials in 2018 and 2019, the rate has been falling since January 2020.
Figure 4: Average Down Payment (%) by Generational Group

Younger Generations Continue to Take on Increasing Levels of Debt in Order to Purchase a Home
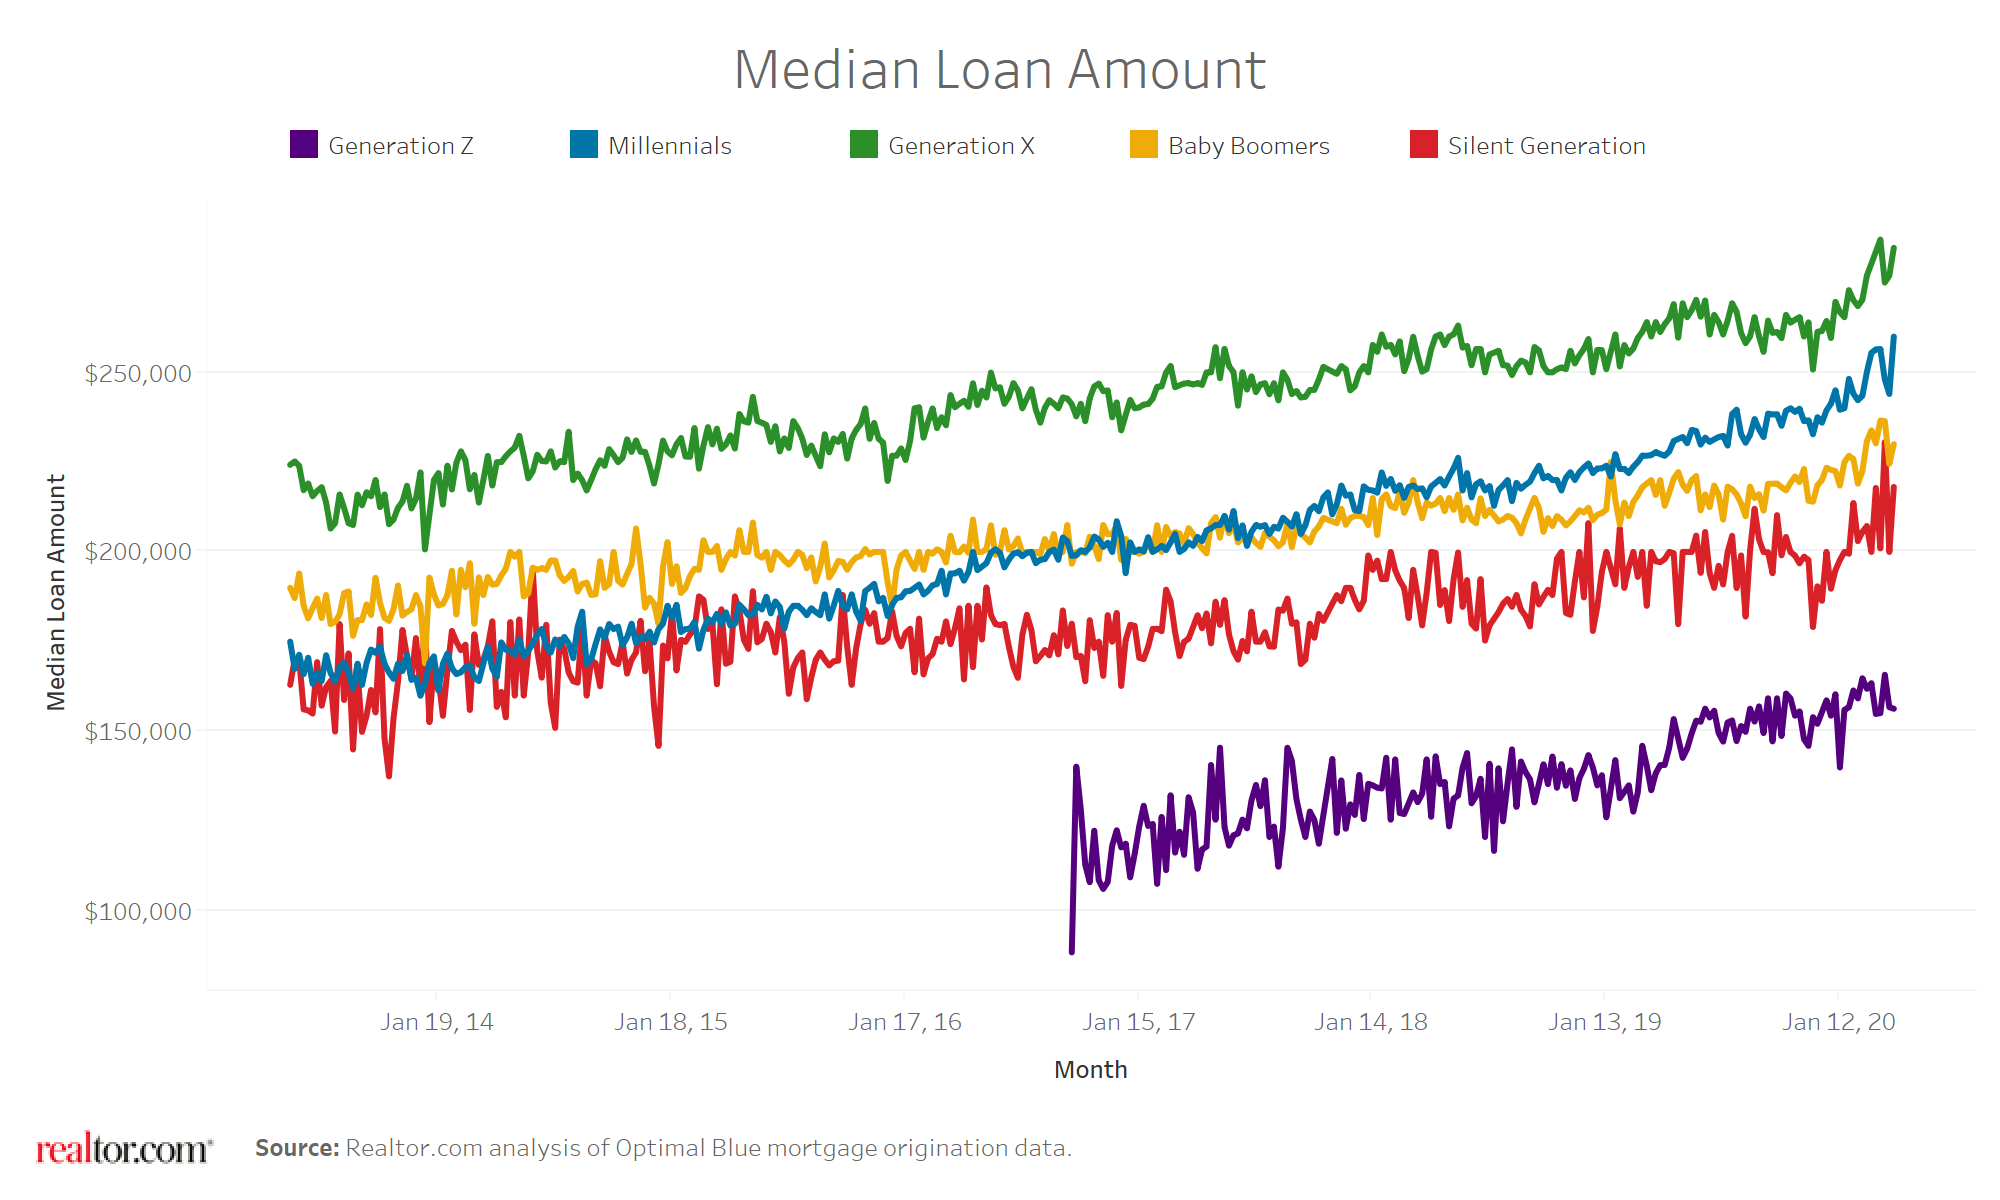
The median loan amount taken on by millennials continues to increase at a rapid rate. Despite millennials just now catching up to baby boomers in the price of homes purchased, the median loan amount taken on by millennials surpassed that for boomers in 2017, and the differential has continued to grow. The median loan amount taken on by baby boomers is effectively lower because of their ability to contribute a larger down payment. Millennials took a median loan amount of $260,000 in the week ending April 11, which is 14.5 percent higher than last year. Meanwhile, baby boomers took out a median loan amount of $230,000, which is only 4.5 percent higher than last year. The median loan amount taken on by Generation Z was $156,300, and it also grew by a high 11.2 percent over the past year.
Figure 5: Median Loan Amount by Generational Group
Where Is Each Generation Still Buying During the COVID-19 Crisis?
We compared housing markets according to their share of primary home purchase mortgages for each generational group between March 11 and April 13 to the same time period last year to see how each generational group’s purchasing patterns have changed in response to the ongoing COVID-19 pandemic. While their behavior shares some similarities, with less relative purchasing activity in highly-affected markets such as New York and Detroit, the metropolitan areas which gained a relative share of purchasing activity differed within the generational groups.
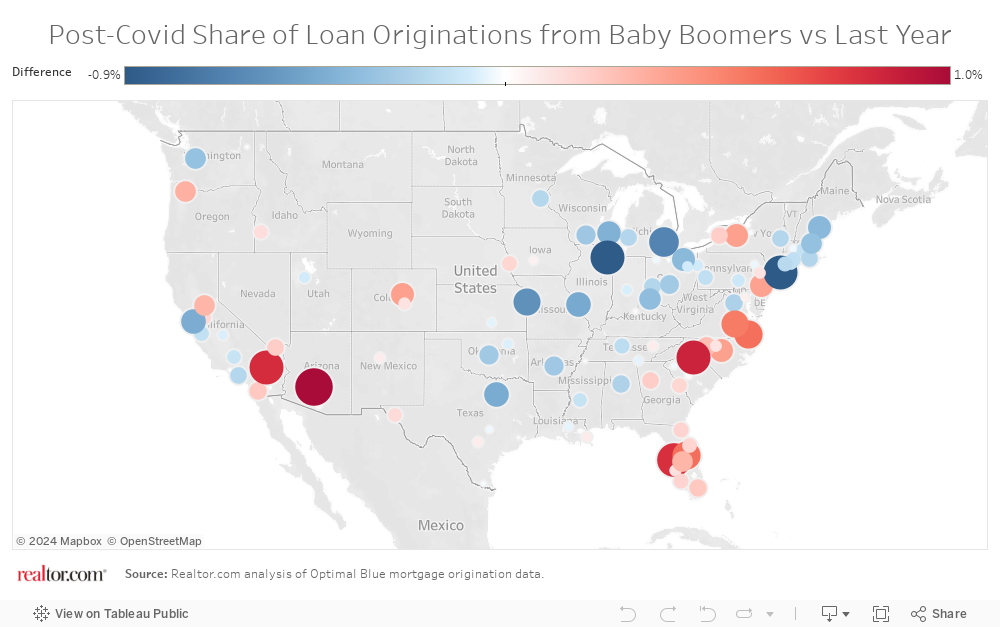
Baby Boomers Are Still Active in Hotter Climates and Vacation Destinations
While midwestern and northeastern metropolitan areas such as New York, Chicago, and Detroit declined in their share of baby boomer primary home purchase loan originations compared to the same time last year, warmer-climate destinations continued to be top choices for the baby boomer generation. Phoenix, Charlotte, Riverside-San Bernardino, and all larger Florida markets saw their share of baby boomer loan originations increase. The Carolinas and several Virginia markets also saw their share of baby boomer loan originations increase.
Top 5 Markets Gaining Share of Baby Boomer Primary Home Loan Originations
- Phoenix-Mesa-Scottsdale, AZ
- Charlotte-Concord-Gastonia, NC-SC
- Riverside-San Bernardino-Ontario, CA
- Tampa-St. Petersburg-Clearwater, FL
- Orlando-Kissimmee-Sanford, FL
Top 5 Markets Losing Share of Baby Boomer Primary Home Loan Originations
- New York-Newark-Jersey City, NY-NJ-PA
- Chicago-Naperville-Elgin, IL-IN-WI
- Detroit-Warren-Dearborn, MI
- Kansas City, MO-KS
- St. Louis, MO-IL
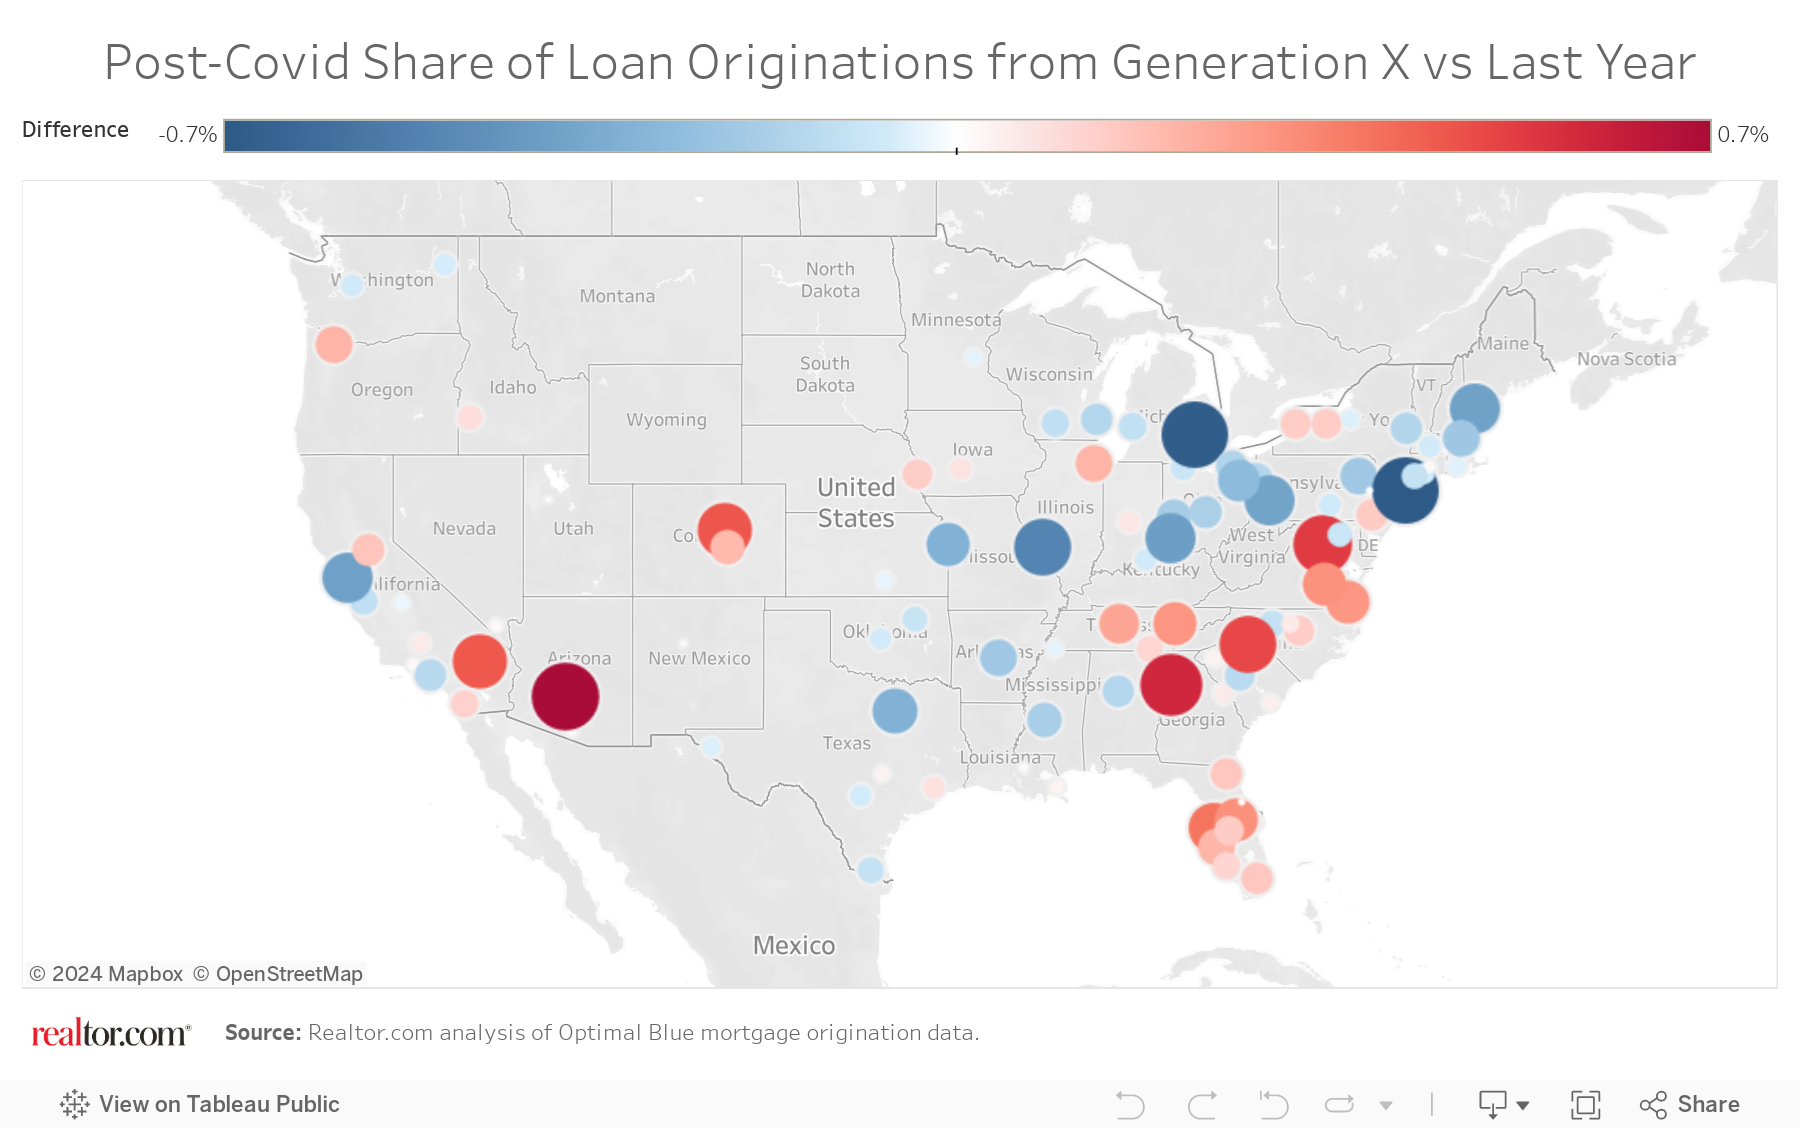
Generation X Shared Similarities with Baby Boomers
Like the baby boomer generation, when compared to the same time last year, Generation X had fewer relative loan originations in New York, Detroit, St. Louis, and San Francisco. Generation X also saw a shift into most large Florida markets, several Virginia markets, Phoenix, Riverside-San Bernardino, and Charlotte, North Carolina. Where the generations differed is that the share of Generation X purchases in Chicago and Washington, D.C., actually increased slightly, instead of decreasing. Generation X shares also increased more than those of the baby boomers did in Atlanta, Colorado, and several markets in Tennessee.
Top 5 Markets Gaining Share of Generation X Primary Home Loan Originations
- Phoenix-Mesa-Scottsdale, AZ
- Atlanta-Sandy Springs-Roswell, GA
- Washington-Arlington-Alexandria, DC-VA-MD-WV
- Charlotte-Concord-Gastonia, NC-SC
- Denver-Aurora-Lakewood, CO
Top 5 Markets Losing Share of Generation X Primary Home Loan Originations
- New York-Newark-Jersey City, NY-NJ-PA
- Detroit-Warren-Dearborn, MI
- St. Louis, MO-IL
- Cincinnati, OH-KY-IN
- San Francisco-Oakland-Hayward, CA
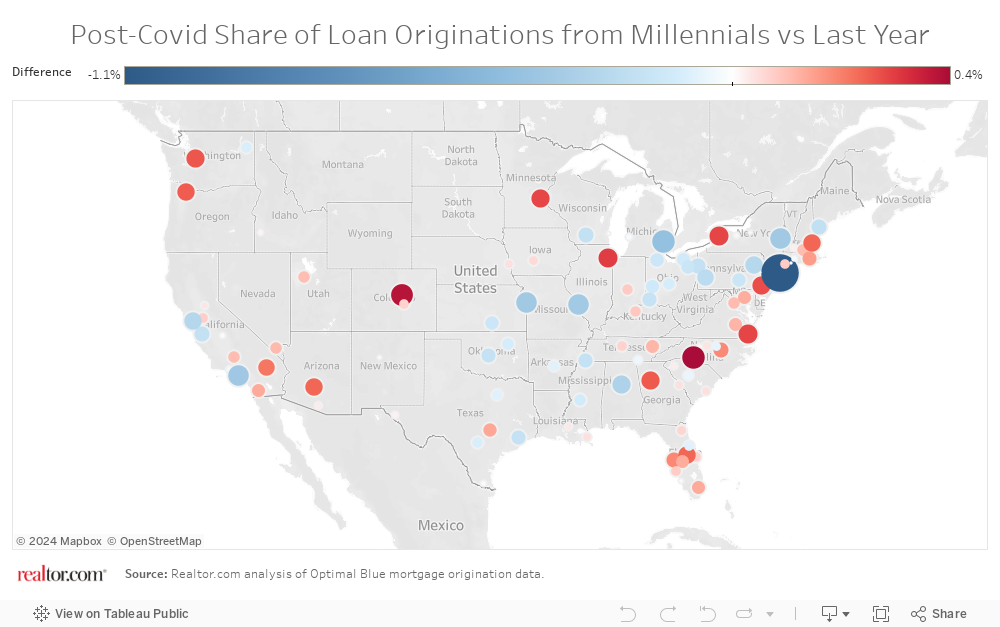
Millennials are More Locked-in-Place
Unlike the baby boomers, and somewhat less than Generation X, the shift in shares of primary home loan originations taken on by millennials were smaller and more evenly distributed in markets across the country. This could possibly be explained by a lack of any consistent geographic preference among millennials, who more than other generations tend to look wherever affordability allows. It could also possibly indicate that millennials are more tied to their local markets- whether due to employment or lack of savings- and are less able to uproot and move further away. Unlike for baby boomers, markets such as Seattle, Minneapolis, Chicago actually gained in the share of millennial primary home loan originations.
Top 5 Markets Gaining Share of Millennial Primary Home Loan Originations
- Charlotte-Concord-Gastonia, NC-SC
- Denver-Aurora-Lakewood, CO
- Chicago-Naperville-Elgin, IL-IN-WI
- Virginia Beach-Norfolk-Newport News, VA-NC
- Buffalo-Cheektowaga-Niagara Falls, NY
Top 5 Markets Losing Share of Millennial Primary Home Loan Originations
- New York-Newark-Jersey City, NY-NJ-PA
- Detroit-Warren-Dearborn, MI
- Los Angeles-Long Beach-Anaheim, CA
- Albany-Schenectady-Troy, NY
- Kansas City, MO-KS
* Note: This report does not have a view of changes in generational trends among the cash-buying segment of home purchasers since its primary data source is loan origination data.
Methodology
The Report on Loan Originations by Age and Generational Groups is based on a Realtor.com analysis of a sample of residential mortgage loan originations from Optimal Blue. The top market rankings were calculated using a group’s mortgage origination share.
The generational groups are defined as follows:
- Silent Generation: born before 1946
- Baby Boomers: born between 1946 and 1964
- Generation X: born between 1965 and 1980
- Millennials: born between 1981 and 1996
- Generation Z: born between 1997 and 2012
Subscribe to our mailing list to receive monthly updates and notifications on the latest data and research.