Housing Market Recovery Index Highlights – Week Ending June 13
- Nationally, the overall housing market is inching towards recovery as buyer interest and home price growth surpass pre-COVID19 levels — but more ground left to cover as growth in new supply and the pace of sales still lagging
- Locally, four new markets reach the recovery benchmark taking the total to eight of the 50 largest markets — this week’s data suggests markets with stronger job creation pre-COVID may have a crucial edge in the recovery
- The overall recovery index is showing greatest recovery in Denver, Boston, Seattle, San Francisco and San Diego, all five being established tech hubs with strong job markets pre-COVID.
National Recovery Trends
The realtor.com Housing Market Recovery Index for the week ending June 13 reached 90.0 nationwide, up 1.2 points over the prior week and 10.0 points below the January trend baseline. The slight increase in this week’s overall index represents a 6.9 points increase over the 83.1 trough reached the week ending May 2.
Nationally, this means real estate activity is inching closer to January trends and nearly half way through the path to a full recovery. As the market heads into the summer, two of the four recovery index components, ‘housing demand’ and ‘home prices’, remain above their January baseline. However, the other two components, ‘new supply’ and ‘pace of sales’, remain visibly below January baselines, with both measures avoiding decreases but failing to see significant jumps over last week.
The ‘housing demand’ component – which tracks growth in online search activity – remained visibly above recovery, with this week’s index reaching 123.3, up 9.3 points over the prior week, and 23.3 points above the January baseline. The current demand index represents a 44.1 point increase over the April 4 trough. Homebuyer interest recovered quickly post COVID-19 and remains high despite the weaker economic environment, as low mortgage rates, virtual tools, and lockdown lifts have enabled many buyers to continue the home search process, albeit often with adaptations. Housing remains an essential good, and this activity demonstrates that real estate can remain fairly active even during recessionary periods.
The ‘home price’ component – which tracks growth in asking prices – moved further past the recovery threshold, with this week’s index reaching 101.0, up 0.3 points over the prior week and 1.0 points above the January baseline. This week’s price growth index also represents a 4.3 point increase over the April 18 trough. Although asking prices did not decline, price gains quickly lost momentum post COVID-19. Prices have regained momentum as the mix of inventory shifts back toward higher priced properties and demand for entry-level properties surges. With supply largely constricted and buyer competition on the rise, sellers have regained leverage in recent weeks, pointing to more price growth is likely ahead.
The ‘housing supply’ component – which tracks growth of new listings – continues to follow a path to recovery after posting a slight weekly jump. This week’s new listings index reached 88.0, up 0.7 points over the prior week and just 12.0 points below the January baseline. The current index also represents a 27.3 point increase over the April 11 trough. While lockdown measures subside, and foot traffic resumes, we have yet to see normal levels of listings enter the market. Economic uncertainty, civil unrest and lingering coronavirus concerns remain short term threats to seller confidence. If these conditions persist, we could see the influx of newly listed properties remain constrained in the coming weeks.
The ‘pace of sales’ component – which tracks differences in time-on-market – has remained stable over the past week. This week’s time-on-market index reached 69.9, flat compared to the prior week, and still 30.1 points below the January baseline. As more buyers and sellers reunite, age of inventory may decrease and start reverting back to more normal seasonal trends. However, the closing process remains more labored than usual and time on market still remains materially higher than last June.It could take a few weeks for the pace of sales to show improvement, even as demand and supply improve.
Local Recovery Trends
Locally, an additional four markets have crossed the recovery benchmark this week, taking the total number of markets above the January baseline to eight. The overall recovery index is showing greatest recovery in Denver, Boston, Seattle, San Francisco and San Diego.
An emerging pattern in the local recovery is the role of local economies. Indeed, this week’s data proves that markets with stronger job creation pre-COVID have had an edge on the path to recovery. Notably, the top 5 most-recovered housing markets carried more robust job markets last spring compared to the US overall, with unemployment rates at 2.7 vs 3.6 percent respectively in April 2019. Like the rest of the country, these five have lost a significant amount of jobs since March, but their strength going into the COVID-19 slowdown has made them more resilient. Unemployment rates in these five markets remain just below the national average at 14.5 vs 14.7 percent respectively in April 2020.
A significant part of this resiliency can be linked to job growth in the technology sector. Not coincidentally, most of these rapidly recovering markets also tend to be the same major tech hubs that bloomed over the last 15 years. According to a recent Brookings Institute study, just five top innovation metro areas, Boston, San Francisco, San Jose, Seattle, and San Diego, accounted for more than 90% of all technology jobs created in the U.S. during 2005 to 2017. Denver was not far behind in the list of top hubs at number 8. As more tech companies weather the storm, and sustain, recover and create high paying jobs, demand for homes should remain strong in these hubs for the rest of the year.

In the ‘housing demand’ component, which is the most-recovered index component, all of the 50 largest markets are now positioned above the recovery trend. Notably, markets where online search activity has recovered the most also experienced a slower pace of growth in January. Online interest in the top 10 most and least recovered markets was growing at 17 and 20 percent year-over-year in January respectively on average. While this suggests markets with a fast growing number of home shoppers pre-COVID have a higher bar for recovery, they may not need to reach the same pace of growth to see home sales reignite. Among the most recovered markets for home-buying interest sit Miami, Birmingham, Atlanta, Riverside, and Seattle, with a housing demand growth index between 138.0 and 151.7.
In the ‘home price’ component, more markets are now positioned above the recovery trend this week, with 15 of the 50 largest markets now seeing the median list price index surpass the January baseline. In the top 10 most-recovered markets for price, median asking prices are now growing at a healthy 9 percent year-over-year. Interestingly, markets where asking prices have recovered the most tend to be lower priced than those that have not yet recovered, pointing to housing affordability as a factor in the reacceleration of price gains. The median list price in the top 10 most and least recovered markets sat at $341,000 and $501,000 respectively on average. Among the most recovered markets for home prices sit Pittsburgh, Louisville, Minneapolis, Cleveland and Providence, with a home price growth index between 104.4 and 110.9.
In the ‘housing supply’ component, a record high 12 of the 50 largest markets are now seeing the new listings index surpass the January baseline. However, in the top 10 most-recovered markets for new supply, new listings are still down 12 percent year-over-year. Interestingly, markets where new supply is improving the fastest tend to be higher priced than those that have yet recovered, suggesting sellers are becoming more confident and active in the more expensive markets. The median list price in the top 10 most and least recovered markets sat at $607,000 and $326,000 respectively on average. Among the most recovered markets for new listings sit Denver, San Francisco, Seattle, Pittsburgh and Miami, with a new listings growth index between 104.3 and 118.0.
In the ‘pace of sales’ component, only 8 of the 50 largest markets are seeing the time on market index surpass the January baseline. However, in the top 10 most recovered markets for new supply, time-on-market is still up 6 percent year over year. Interestingly, markets where time on market is recovering the fastest tend to be faster moving than those with a slower recovery, suggesting seller markets pre-COVID may be better positioned for recovery in the months ahead, as the relative strength helps draw sellers back to the market sooner. The median time on market in the top 10 most and least recovered markets sat at 42 and 64 days respectively on average. Among the most recovered markets for time-on-market sit Boston, San Diego, Rochester, Los Angeles and Louisville, with a pace of sales growth index between 105.2 and 113.7.
Top 10 Most Recovered Markets – Week Ending June 13
| Index Rank | Metro | Recovery Index (Week ending 6/13) | ||||
| 1 | Denver-Aurora-Lakewood, CO | 107.6 | ||||
| 2 | Boston-Cambridge-Newton, MA-NH | 106.7 | ||||
| 3 | Seattle-Tacoma-Bellevue, WA | 106.0 | ||||
| 4 | San Francisco-Oakland et al, CA | 104.5 | ||||
| 5 | San Diego-Carlsbad, CA | 104.5 | ||||
| 6 | Rochester, NY | 101.3 | ||||
| 7 | Las Vegas-Henderson-Paradise, NV | 101.1 | ||||
| 8 | Los Angeles-Long Beach et al, CA | 100.5 | ||||
| 9 | Austin-Round Rock, TX | 99.0 | ||||
| 10 | Detroit-Warren-Dearborn, MI | 97.5 |
Top 10 Most Improved Markets the Prior Week – Week Ending June 13
| Rank | Metro | Recovery Index (Weekly Change) |
Recovery Index (Week ending 6/13) |
|||
| 1 | Buffalo-Cheektowaga et al, NY | 20.6 | 81.6 | |||
| 2 | Detroit-Warren-Dearborn, MI | 12.3 | 97.5 | |||
| 3 | Baltimore-Columbia-Towson, MD | 10.6 | 96.8 | |||
| 4 | Richmond, VA | 8.6 | 93.2 | |||
| 5 | Philadelphia et al, PA-NJ-DE-MD | 8.2 | 94.7 | |||
| 6 | Washington et al, DC-VA-MD-WV | 8.1 | 96.6 | |||
| 7 | Los Angeles-Long Beach et al, CA | 7.8 | 100.5 | |||
| 8 | Rochester, NY | 7.6 | 101.3 | |||
| 9 | Birmingham-Hoover, AL | 7.1 | 96.3 | |||
| 10 | St. Louis, MO-IL | 7.1 | 90.6 |
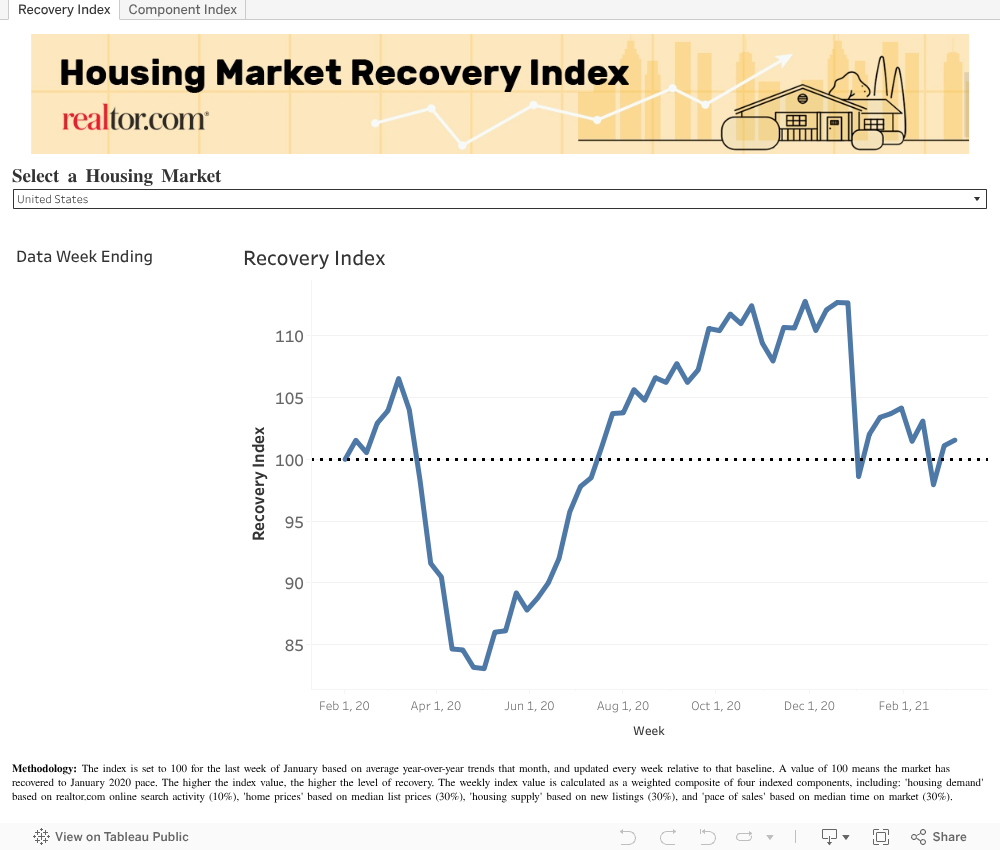
How to read the index – the overall index is set to 100 for the last week of January based on average year-over-year trends that month, and updated every week relative to that baseline. A value of 100 means the market has recovered to January 2020 pace. The higher the index value, the higher the level of recovery. The lower the index value, the lower the level of recovery.
Subscribe to our mailing list to receive monthly updates and notifications on the latest data and research.